1. Introduction
The Dashboards page shows an overview of all key statistics within the Verax Control Center.
2. Sorting the Dashboards
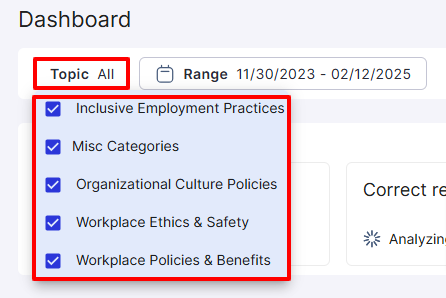
The information on the Dashboards page can be sorted by topic and date range.
To sort by topic, click Topic at the top and check the box to the left of the topics by which you want to sort.
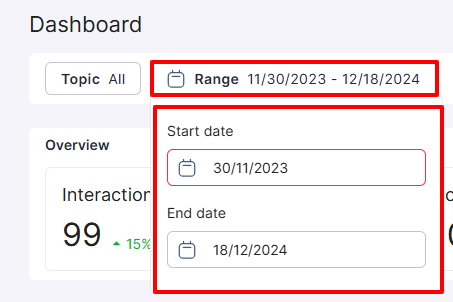
To sort by date range, click Range at the top and select the Start date and End date.
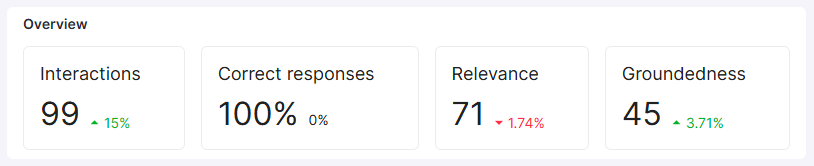
3. Overview
The Overview pane shows a complete overview of the key statistics for your chatbot interactions and the percentage change in the selected date range compared to previous date ranges. Use this screen to quickly identify trends and issues with your LLMs. These include:
Interactions - The number of interactions recorded.
Correct responses - The percentage of correct chatbot responses to user requests.
Relevance - The Relevance score of the chatbot interactions.
Groundedness - The Groundedness score of the chatbot interactions.
4. Timeline
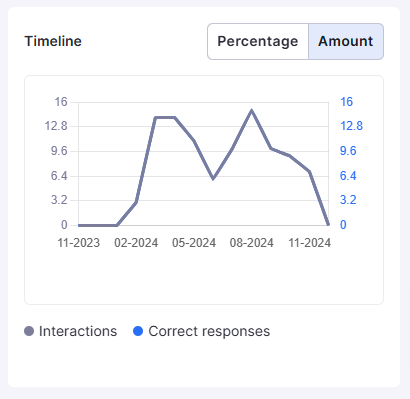
The Timeline pane shows a graph of your chatbot interactions and corresponding correct responses in percentage and amount totals.
Click Percentage to see the percentage of correct responses per interactions for a date range. This graph shows the hallucination threshold, which indicates the percentage of hallucinations expected from chatbots. 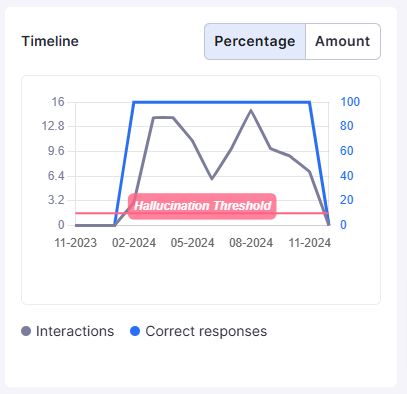
Click Amount to see the amount of correct responses per interactions for a date range.
5. Breakdown Per Topic
The Breakdown per topic pane shows a breakdown of interaction by topic.
The left-hand side shows the topic name and associated categories, while the right-hand side shows the correctness percentage. Topics and categories are automatically generated by Verax based on your interactions and knowledge base. Use this screen to dive deep into various interactions by topic and category to see how accurately your chatbots cover various topics.
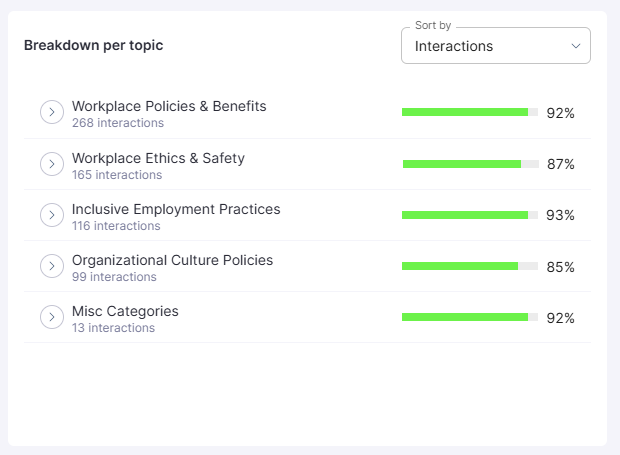
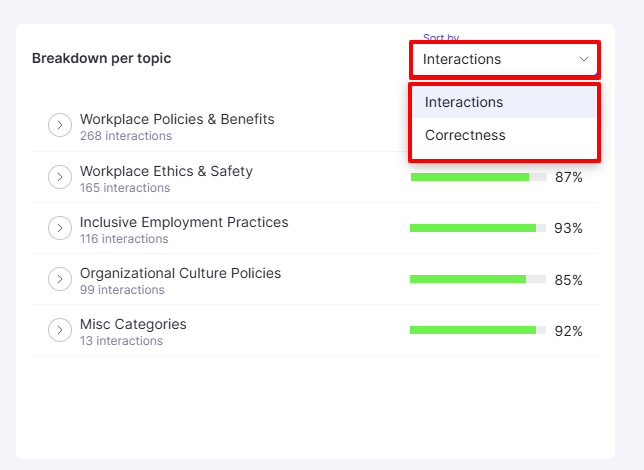
Sort the screen by the number of interactions or correctness percentage under Sort by. To sort the results in the pane by the number of interactions, choose Interactions. To sort the results in the pane by the correctness percentage, choose Correctness.
Click the arrow to the left of topics that have multiple categories to see the category breakdown.
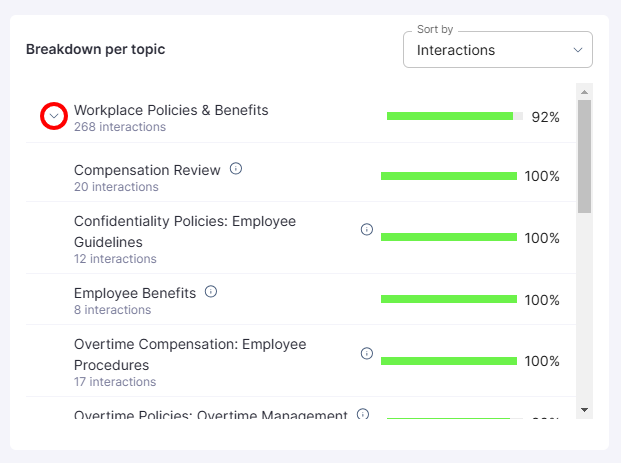
Click any individual category to see the specific individual interactions for the category. This opens the Interactions screen with filters automatically assigned to only the show the specific category. Learn more about Interactions.
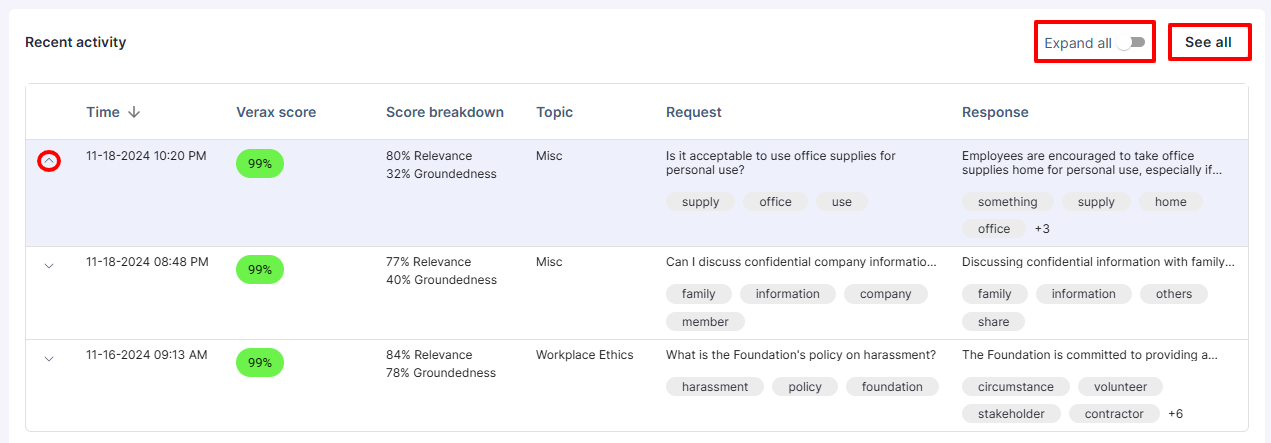
6. Recent Activity
The Recent activity pane shows the most recent interactions between your chatbot an your users. Click the arrow to the left of any interaction to see the full information for that interaction.
Click Expand all to show the full information for all listed interactions.
Click See all to open the Interactions page and see all interactions. Learn more about Interactions.