1. Introduction
The Dashboard page shows a variety of key graphs and figures for your Verax Protect ecosystem.
2. Understanding the Dashboard Page
Use the Dashboard page to obtain a full view of your environment in Verax Protect.
The information shown on the Dashboard page can be sorted by date range.
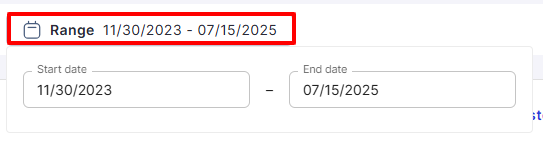
To sort by date range, click Range at the top and select the Start date and End date.
The dashboard page shows the following:
Interactions dashboard
Number of interactions.
Number of interactions analyzed and blocked.
Number of interactions analyzed and found safe.
Number of interactions on which protection was skipped.
The total amount of risks mitigated by Verax within the selected time period.
Security incidents dashboard
The number of potential security incidents.
The number of security incidents blocked.
The number of security incidents with data redacted.
The categories under which the security incidents fall.
Users dashboard
The number of unique users.
The top risky users.
User ID
Number of interactions
Number of blocked interactions
Number of redacted and safe interactions
Risk score
The most active users.
User ID
Number of interactions
Number of blocked interactions
Number of redacted and safe interactions
Risk score